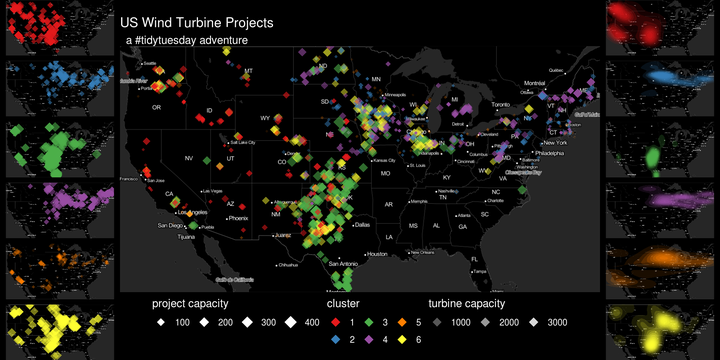
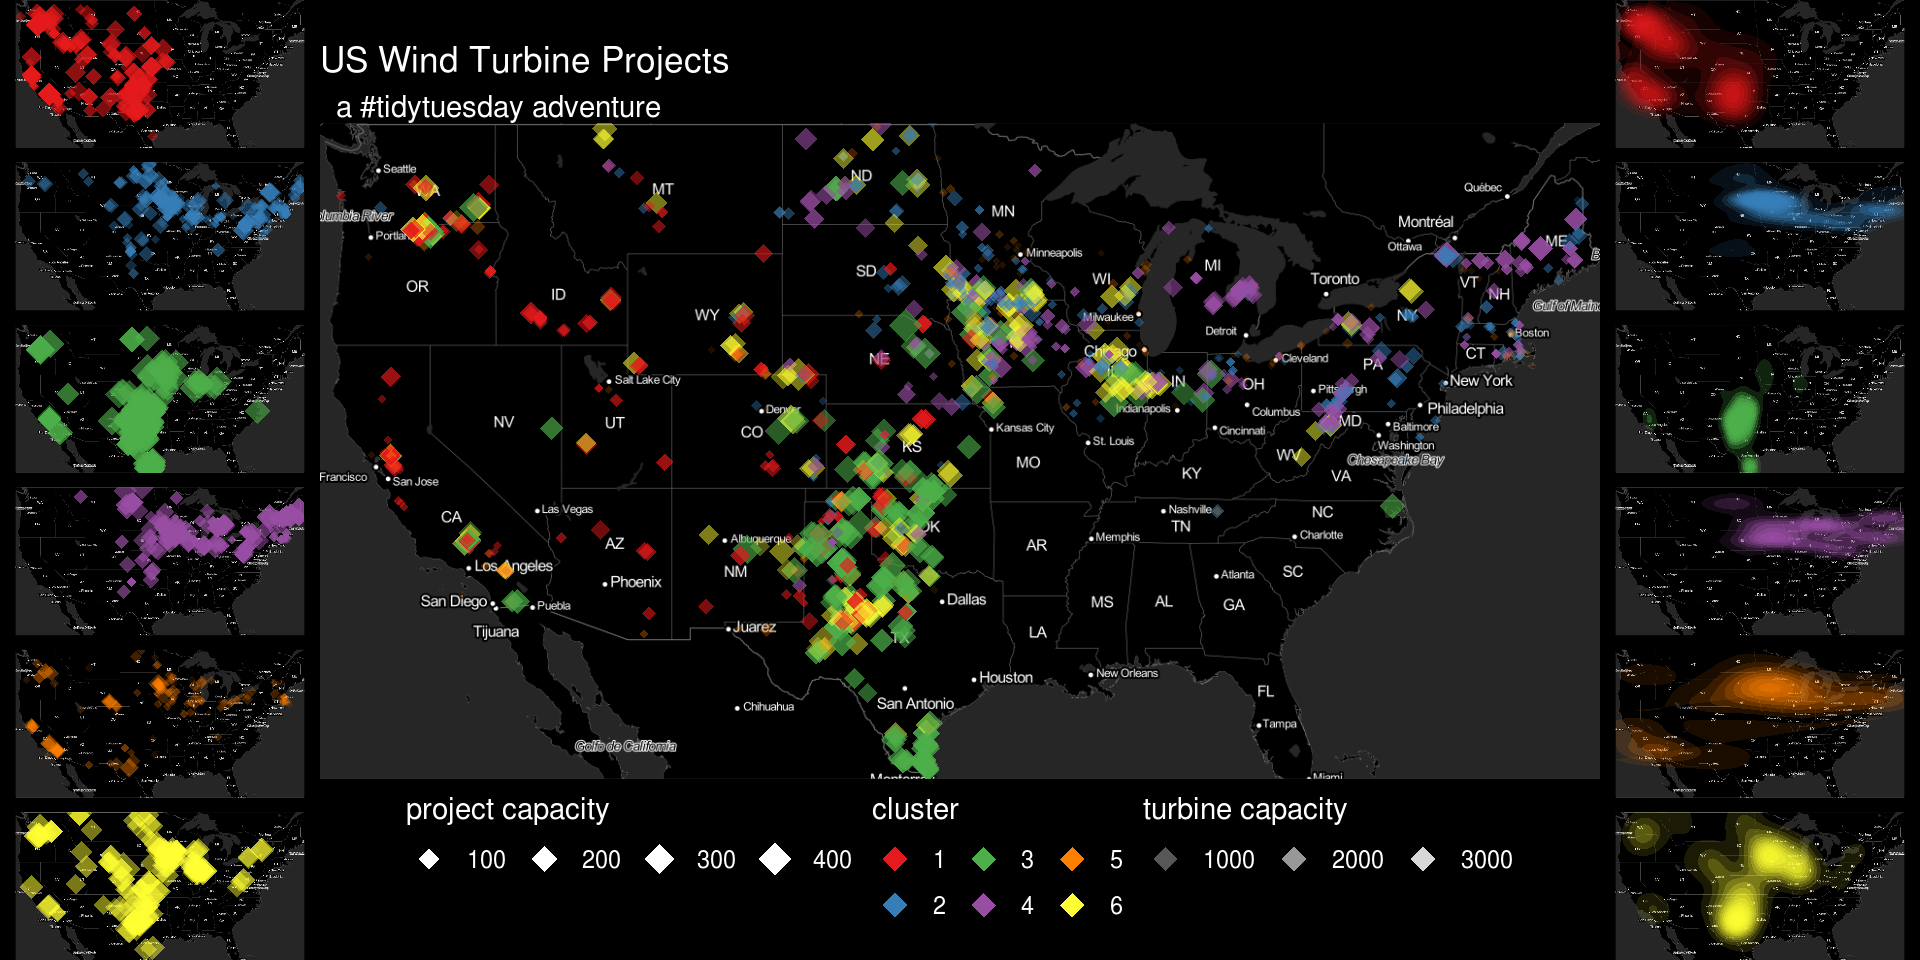
Tidy Tuesday: USA Wind Power

Load Data
dat <- read_csv("https://github.com/rfordatascience/tidytuesday/raw/master/data/2018/2018-11-06/us_wind.csv")## Parsed with column specification:
## cols(
## .default = col_double(),
## faa_ors = col_character(),
## faa_asn = col_character(),
## t_state = col_character(),
## t_county = col_character(),
## t_fips = col_character(),
## p_name = col_character(),
## t_manu = col_character(),
## t_model = col_character(),
## t_img_date = col_character(),
## t_img_srce = col_character()
## )## See spec(...) for full column specifications.## get all the missing data to NA
dat <- dat %>% mutate_all(.funs = funs(replace(., . %in% c(-9999, "missing"), NA)))## Warning: `funs()` is deprecated as of dplyr 0.8.0.
## Please use a list of either functions or lambdas:
##
## # Simple named list:
## list(mean = mean, median = median)
##
## # Auto named with `tibble::lst()`:
## tibble::lst(mean, median)
##
## # Using lambdas
## list(~ mean(., trim = .2), ~ median(., na.rm = TRUE))
## This warning is displayed once every 8 hours.
## Call `lifecycle::last_warnings()` to see where this warning was generated.## drop rows and columns with high missing
dat.comp <- dat %>% select_if( function(x){sum(is.na(x))/length(x) < .15}) %>%
filter(rowMeans(is.na(.)) < 0.15)
## get info at project level
dat.p.num <- dat.comp %>% group_by(p_name) %>%
select_if(is.numeric) %>% select(-case_id) %>%
summarise_all(.funs = function(x){mean(x, na.rm = T)}) %>%
ungroup %>% select(-p_name) %>% filter(rowSums(is.na(.)) == 0) %>%
filter(xlong < 100 & xlong > -125 & ylat > 20) %>% ## remove some geographic outliers
filter(t_cap > 0 & t_cap < 6000) Reduce Dimensionality
Do a PCA
Looks like PC1 makes up the bul of the difference, and it is due to turbine rotor sweep area
dat.pca <- prcomp(dat.p.num, center = TRUE, scale. = TRUE)

summary(dat.pca)
## Importance of components:
## PC1 PC2 PC3 PC4 PC5 PC6 PC7
## Standard deviation 2.3420 1.3762 1.00832 0.98379 0.94979 0.86079 0.7040
## Proportion of Variance 0.4571 0.1578 0.08473 0.08065 0.07517 0.06175 0.0413
## Cumulative Proportion 0.4571 0.6149 0.69963 0.78028 0.85546 0.91720 0.9585
## PC8 PC9 PC10 PC11 PC12
## Standard deviation 0.53133 0.35791 0.27616 0.10600 0.01020
## Proportion of Variance 0.02353 0.01067 0.00636 0.00094 0.00001
## Cumulative Proportion 0.98202 0.99270 0.99905 0.99999 1.00000dat.pca$rotation %>% as.data.frame() %>% rownames_to_column() %>%
ggplot(aes(y = PC1, x = rowname)) +
geom_col()
Some plots
dat.p.num %>%
  bind_cols(as.tibble(dat.pca$x)) %>%
  ggplot(aes(x = xlong, ylat, color = PC1, size = p_cap, alpha = t_cap)) +
  scale_color_viridis_c() +
  geom_point()
## Warning: `as.tibble()` is deprecated as of tibble 2.0.0.
## Please use `as_tibble()` instead.
## The signature and semantics have changed, see `?as_tibble`.
## This warning is displayed once every 8 hours.
## Call `lifecycle::last_warnings()` to see where this warning was generated.
Cluster
## Use the PCs that explain 95% of the variance
dat.k <- dat.pca$x %>% as.tibble %>%
  select(1:7) %>%
  mutate(
    k2 = kmeans(., 2)$cluster,
    k3 = kmeans(., 3)$cluster,
    k4 = kmeans(., 4)$cluster,
    k5 = kmeans(., 5)$cluster,
    k6 = kmeans(., 6)$cluster
  ) %>% bind_cols(dat.p.num)
Cluster Plots
dat.k %>%
  ggplot(aes(x = xlong, ylat, color = as.character(k6), size = p_cap, alpha = t_cap)) +
  scale_color_brewer(palette = "Dark2") +
  geom_point()
dat.k %>%
  ggplot(aes(x = xlong, ylat, color = as.character(k6), size = p_cap, alpha = t_cap)) +
  scale_color_brewer(palette = "Dark2")+
  geom_point() +
  facet_wrap(~ as.character(k6), nrow = 3)
Make a pretty map under the data
library(ggmap)
invert <- function(M) {
  i <- function(x){rgb(t(255-col2rgb(x))/255)}

  m <- M %>% apply(2, i) %>% as.raster()

  class(m) <- class(M)
  attr(m, "bb") <- attr(M, "bb")
  return(m)
  }

us <- c(left = -125, bottom = 25.75, right = -67, top = 49)
m <- get_stamenmap(us, zoom = 5, maptype = "toner-lite")
ggmap(invert(m))
Plots
plot.points <- ggmap(invert(m), extent = 'device') +
  geom_point(aes(x = xlong, y = ylat, color = as.character(k6), size = p_cap, alpha = t_cap), data = dat.k, pch = 18) +
  scale_color_brewer(palette = "Set1") +
  facet_wrap(~k6, ncol = 1) +
  theme_void() +
  theme(legend.position = 'none', strip.text = element_blank()) +
  theme(plot.background = element_rect(fill = "black", color = "black"),
        panel.background = element_rect(fill = NULL))

plot.density <- ggmap(invert(m), extent = 'device') +
  stat_density2d(aes(x = xlong, y = ylat, alpha = ..level.., fill = as.character(k6), color = NULL), data = dat.k, geom = "polygon") +
  scale_fill_brewer(palette = "Set1") +
  facet_wrap(~k6, ncol = 1) +
  theme_void() +
  theme(legend.position = 'none', strip.text = element_blank()) +
  theme(plot.background = element_rect(fill = "black", color = "black"),
        panel.background = element_rect(fill = NULL))

plot.all <- ggmap(invert(m), extent = 'device') +
  geom_point(aes(x = xlong, y = ylat, color = as.character(k6), size = p_cap, alpha = t_cap), data = dat.k, pch = 18) +
  scale_color_brewer(palette = "Set1") +
  guides(
    size = guide_legend(title = "project capacity",title.position = 'top', override.aes = list(color = "white")),
    alpha = guide_legend(title = "turbine capacity",title.position = 'top', override.aes = list(color = "white", size  = 4)),
    color = guide_legend(title = 'cluster', title.position = 'top', override.aes = list(size = 4))
  ) +
  ggtitle("US Wind Turbine Projects", "  a #tidytuesday adventure") +
  theme_void() +
  theme(title = element_text(color = 'white'),
        legend.position = 'bottom',
        legend.background = element_blank(),
        legend.text = element_text(color = "white"),
        legend.title = element_text(color = "white"),
        legend.key = element_blank(),
        axis.text = element_blank(),
        axis.title = element_blank(),
        plot.background = element_rect(fill = "black", color = "black"),
        panel.background = element_rect(fill = NULL))
Squish together
library(cowplot)##
## ********************************************************## Note: As of version 1.0.0, cowplot does not change the## default ggplot2 theme anymore. To recover the previous## behavior, execute:
## theme_set(theme_cowplot())## ********************************************************##
## Attaching package: 'cowplot'## The following object is masked from 'package:ggmap':
##
## theme_nothingfinal.plot <- plot_grid(plotlist = list(plot.points, plot.all, plot.density), nrow = 1, rel_widths = c(.25,1,.25))
ggdraw(final.plot) +
theme(plot.background = element_rect(fill = "black", color =
"black"))