Tidy Tuesday: Milk Production

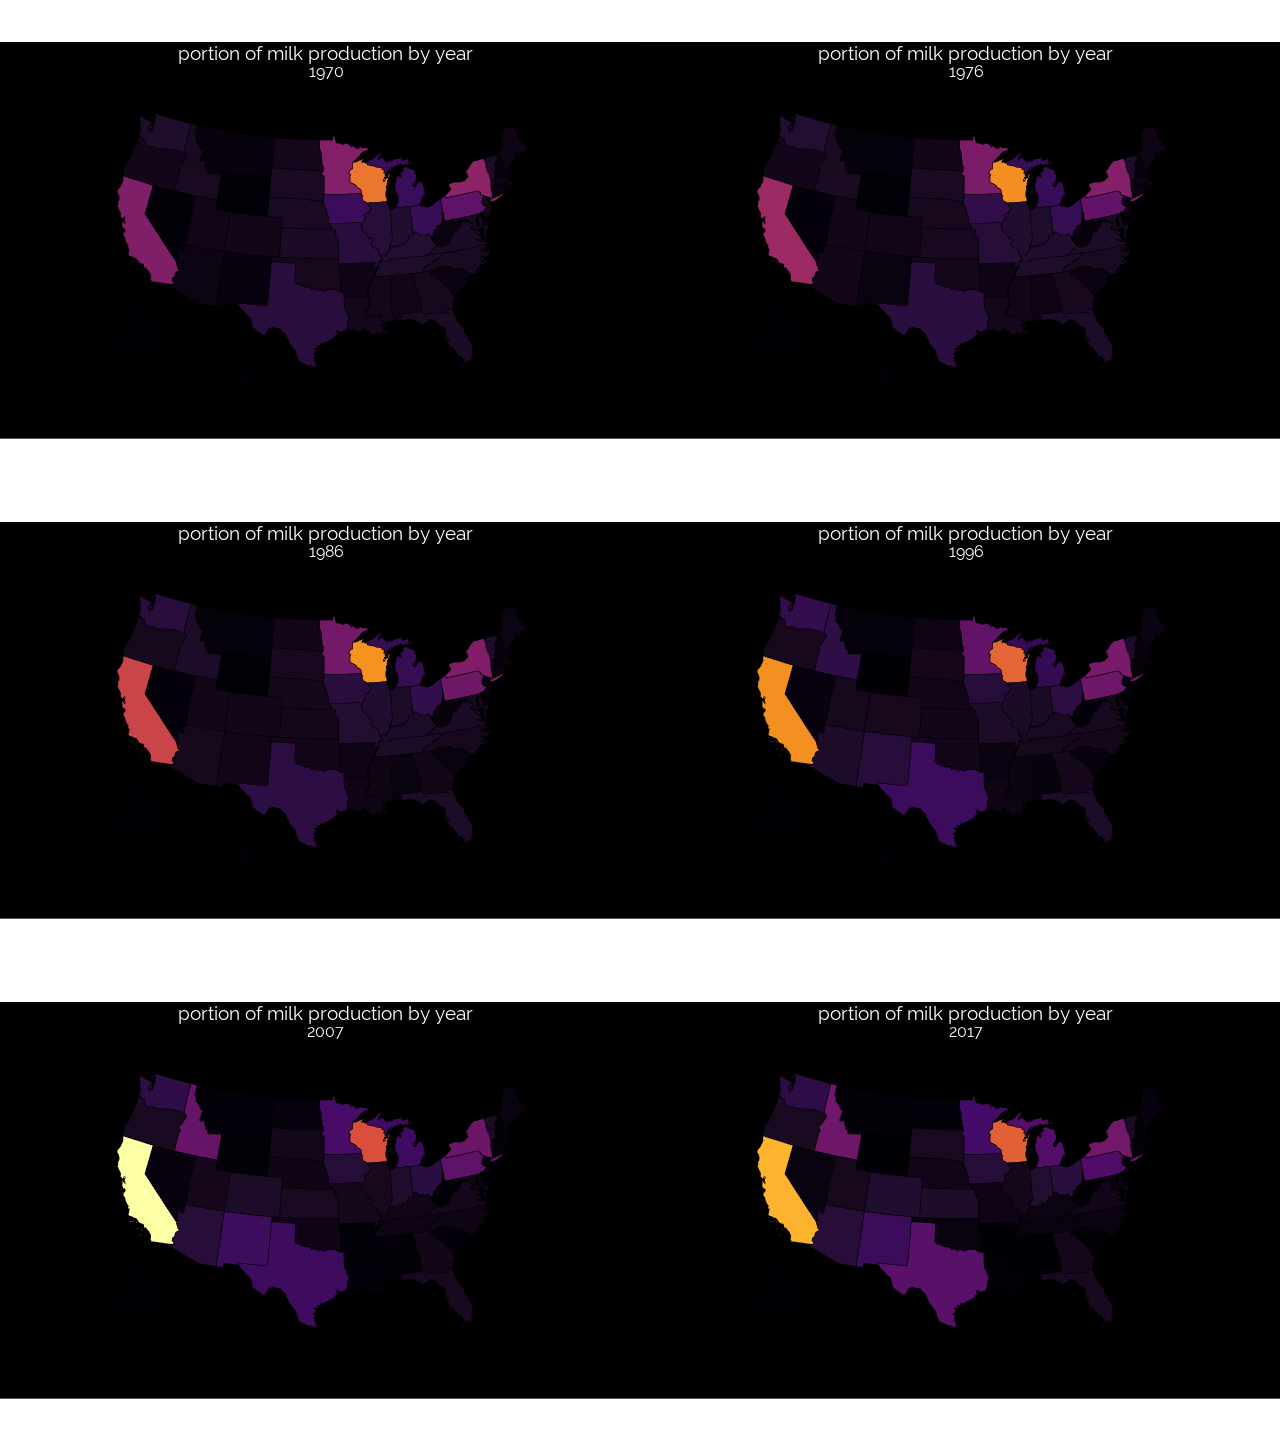
A simple animated gif map.
library(tidyverse)
## ── Attaching packages ───────────────────

## ✔ ggplot2 3.1.0     ✔ purrr   0.2.5
## ✔ tibble  1.4.2     ✔ dplyr   0.7.7
## ✔ tidyr   0.8.2     ✔ stringr 1.3.1
## ✔ readr   1.1.1     ✔ forcats 0.3.0

## ── Conflicts ─── tidyverse_conflicts() ──
## ✖ dplyr::filter() masks stats::filter()
## ✖ dplyr::lag()    masks stats::lag()
require(transformr)
## Loading required package: transformr
library(urbnmapr)
library(gridExtra)
##
## Attaching package: 'gridExtra'

## The following object is masked from 'package:dplyr':
##
##     combine
library(gganimate)
library(patchwork)

source('https://raw.githubusercontent.com/tkoomar/ggplot2_themes/master/theme_black.R')
## Loading required package: showtext

## Loading required package: sysfonts

## Loading required package: showtextdb
milk_state <- read_csv("../data/2019/2019-01-29/state_milk_production.csv")
## Parsed with column specification:
## cols(
##   region = col_character(),
##   state = col_character(),
##   year = col_integer(),
##   milk_produced = col_double()
## )

## Warning in rbind(names(probs), probs_f): number of columns of result is not
## a multiple of vector length (arg 1)

## Warning: 50 parsing failures.
## row # A tibble: 5 x 5 col     row col   expected           actual file                                expected   <int> <chr> <chr>              <chr>  <chr>                               actual 1  1501 year  no trailing chara… e3     '../data/2019/2019-01-29/state_mil… file 2  1502 year  no trailing chara… e3     '../data/2019/2019-01-29/state_mil… row 3  1503 year  no trailing chara… e3     '../data/2019/2019-01-29/state_mil… col 4  1504 year  no trailing chara… e3     '../data/2019/2019-01-29/state_mil… expected 5  1505 year  no trailing chara… e3     '../data/2019/2019-01-29/state_mil…
## ... ................. ... ........................................................................... ........ ........................................................................... ...... ........................................................................... .... ........................................................................... ... ........................................................................... ... ........................................................................... ........ ...........................................................................
## See problems(...) for more details.
milk_state <- milk_state %>%
  rename('state_name' = 'state')


data('states')

milk_map <- left_join(milk_state, states)
## Joining, by = "state_name"
MAKE A MAP
map_plot <- milk_map %>%
  group_by(year) %>%
  mutate(milk_total = sum(milk_produced),
    milk_scaled = milk_produced/milk_total
    ) %>%
  ggplot(aes(x = long, y = lat, fill = milk_scaled, group = group)) +
  geom_polygon(size = 0.25, color = 'black') +
  coord_map(projection = "albers", lat0 = 39, lat1 = 45) +
  scale_fill_viridis_c(option = "inferno")+
  #scale_fill_distiller(palette = 'PuBuGn', direction = 1) +
  theme_black() +
  theme(legend.position = 'none',
        axis.text = element_blank(),
        axis.ticks = element_blank(),
        axis.line = element_blank(),
        axis.title = element_blank(),
        panel.grid = element_blank()) +
  ggtitle("portion of milk production by year", "{closest_state}")
Animate map
map_anim <- map_plot + transition_states(states = year,
                                         transition_length = 5,
                                         state_length = 5,
                                         wrap = TRUE)

anim_save(animation = map_anim,
          filename = "final_plot.gif",
          width = 640
          )
## Warning in lapply(row_vars$states, as.integer): NAs introduced by coercion

## Warning in f(..., self = self): NAs introduced by coercion
The final Plot
